
Football Analytics - Principal Component Analysis (PCA)
Principal Component Analysis (PCA) is a dimensionality reduction technique used to simplify complex datasets while retaining the most important information. It works by identifying the directions (principal components) in which the data varies the most and projecting the data onto a new set of axes aligned with these directions. The first principal component captures the most variance, the second one captures the next largest variance orthogonal to the first, and so on. PCA helps reduce the number of features in a dataset while maintaining the structure and variability of the original data, making it particularly useful for visualizing high-dimensional data or improving the efficiency of machine learning algorithms.
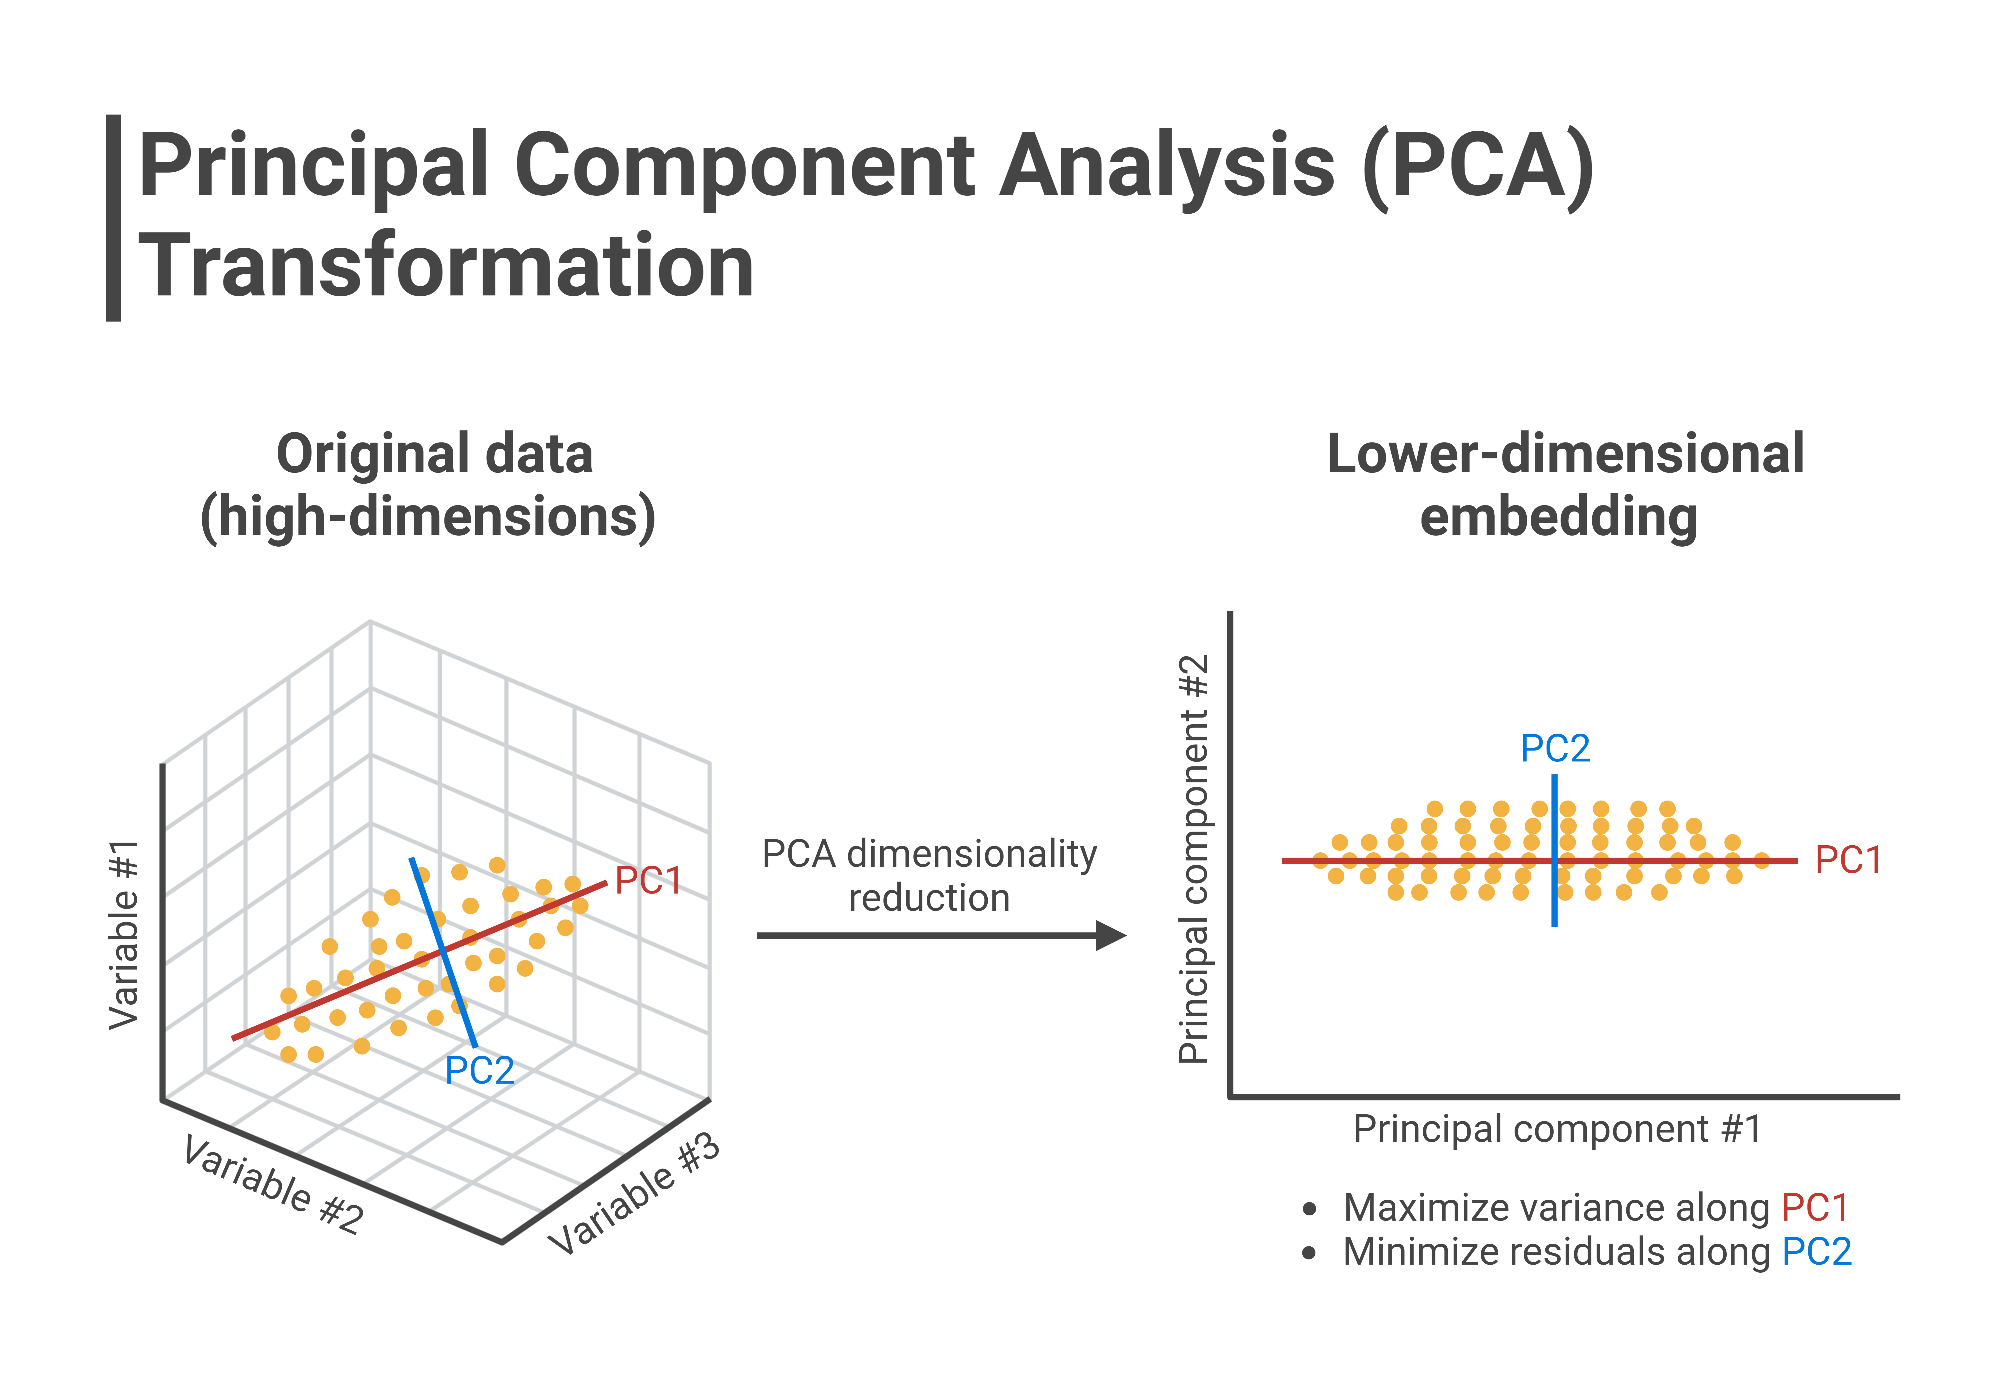
Pricipal Component Analysis
The link to the raw dataset used in this project is provided here. The

Snapshot of Cleaned Dataset used for PCA
We only consider the numerical columns in the dataset for PCA.
PCA Implementation
First Two Principal Components
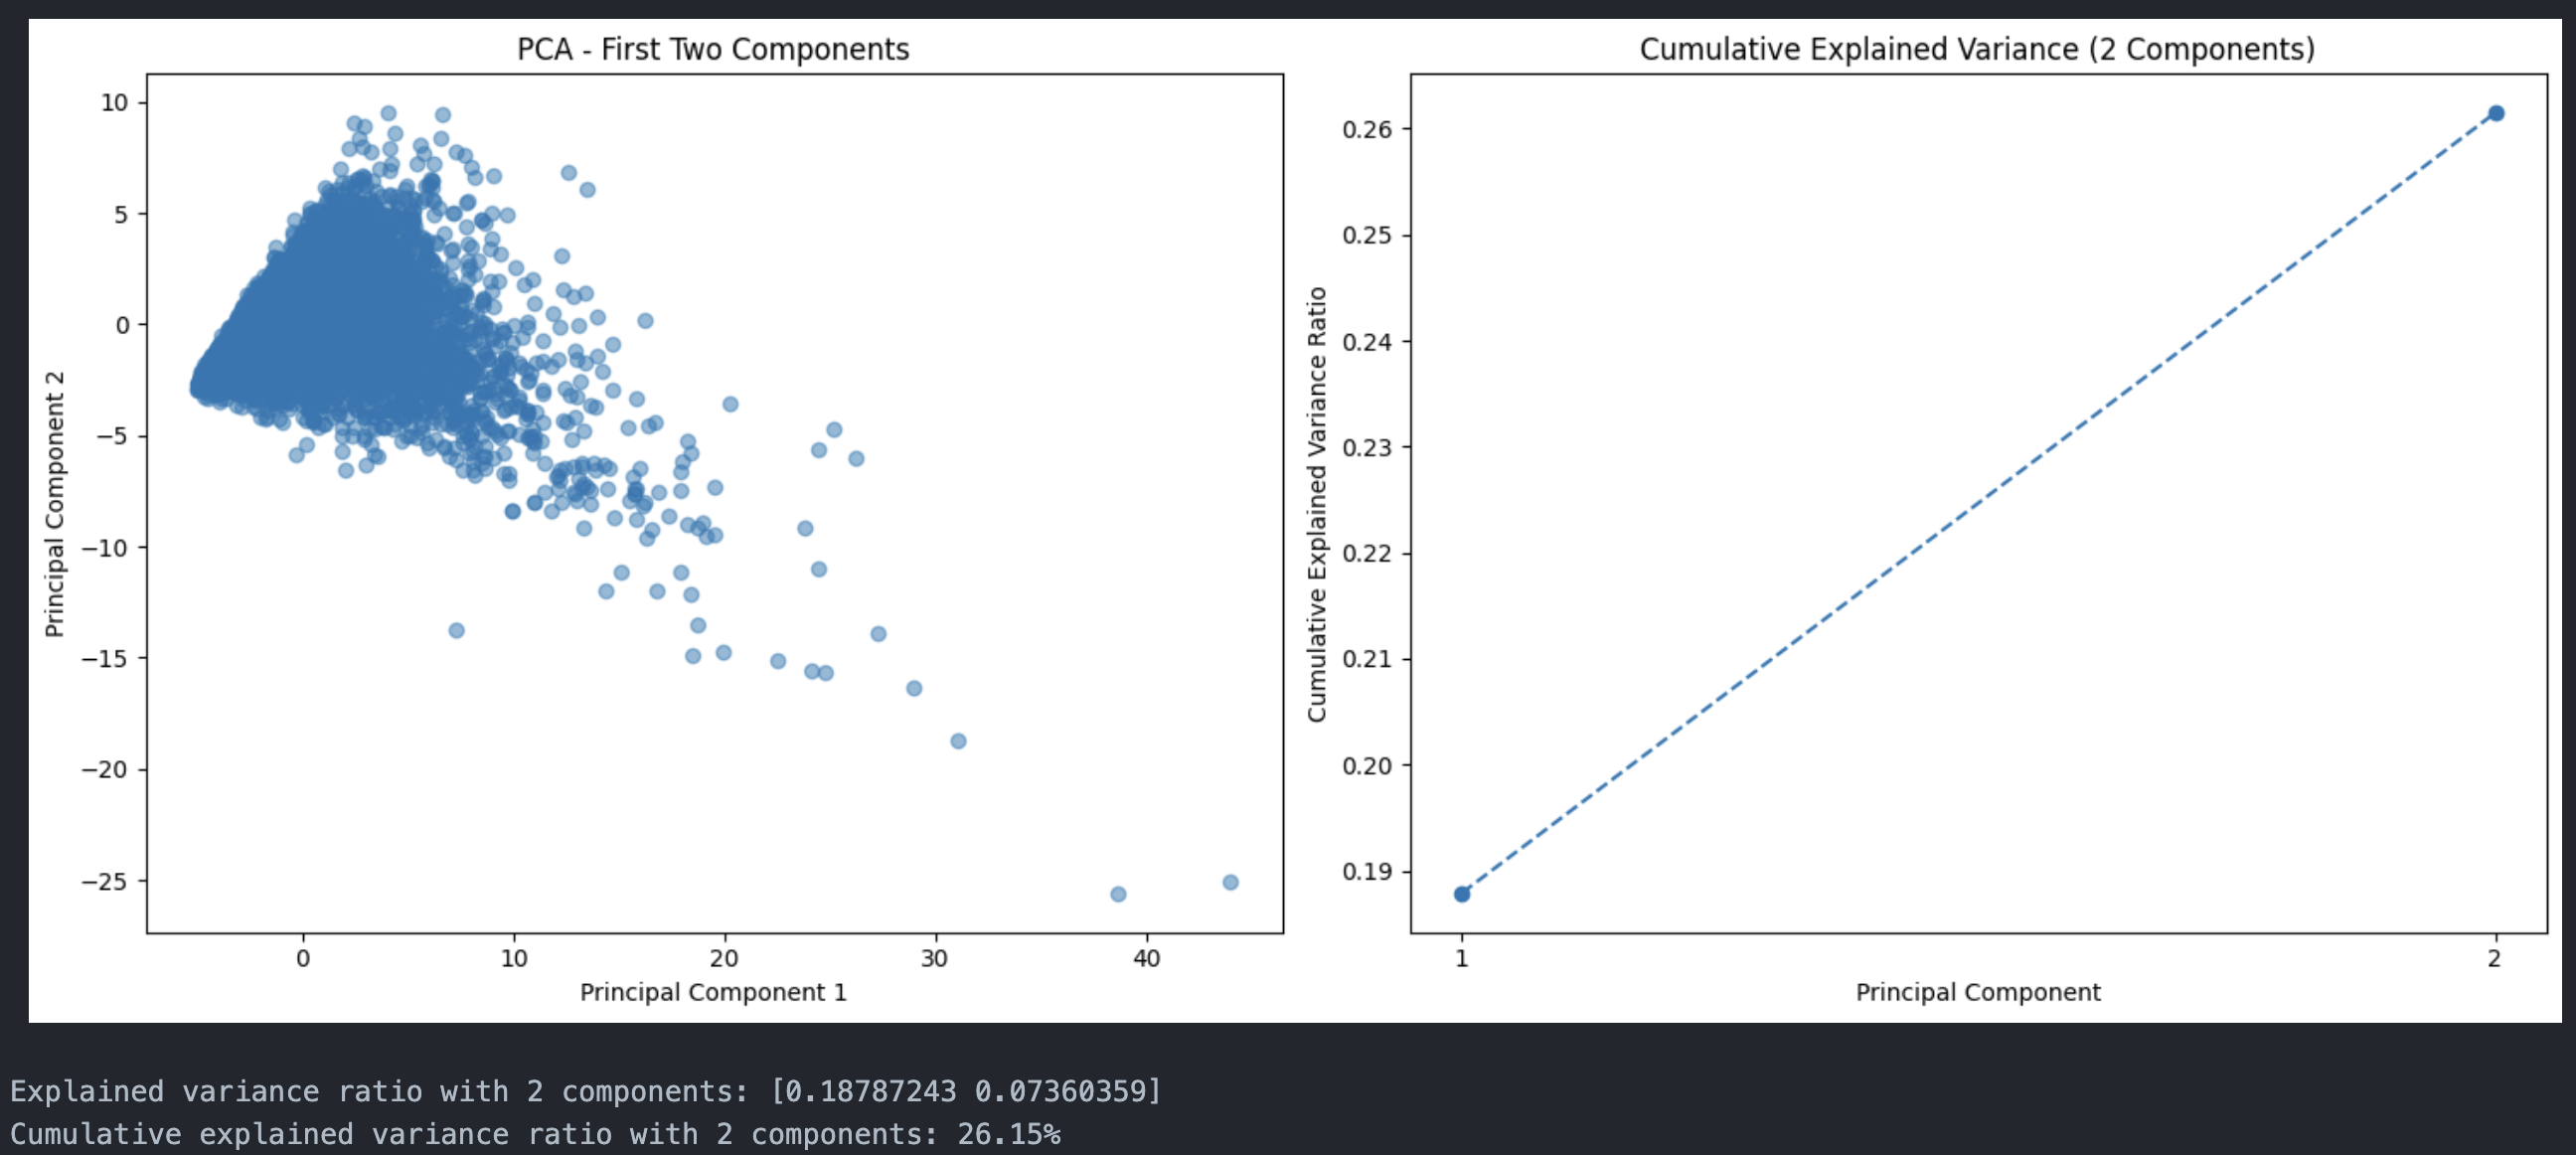
Data projected onto first 2 principal components
The first two principal components captures about 0.19% of the variance.
First Three Principal Components
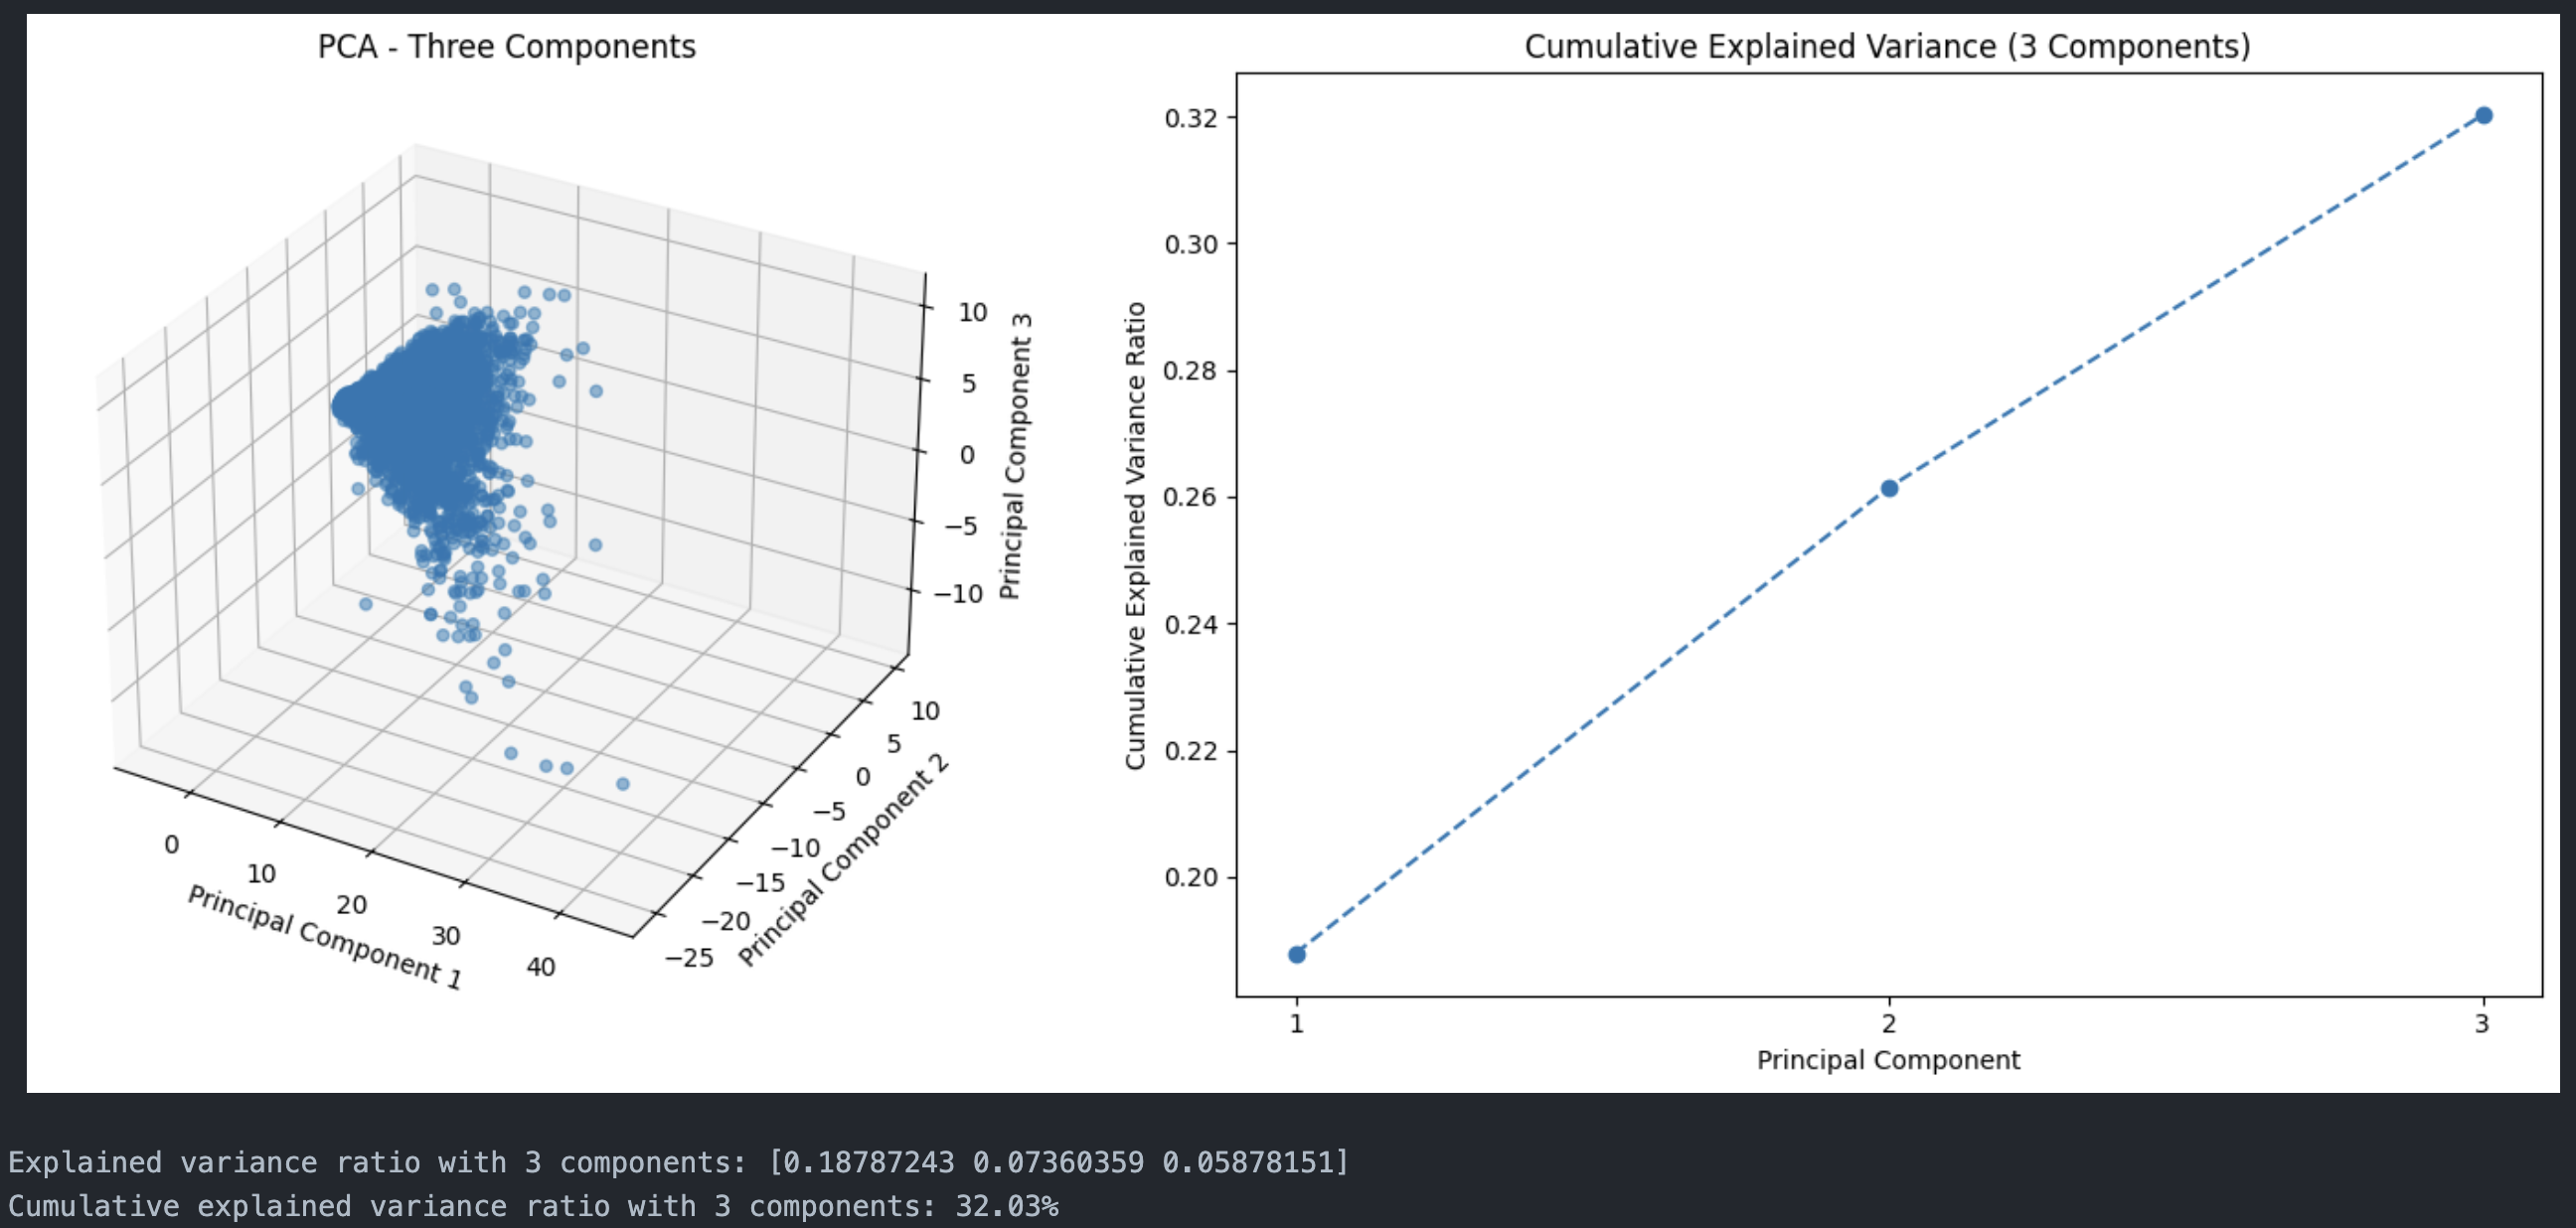
Data projected onto first 3 principal components
The first two principal components captures about 0.25% of the variance.
We can observe that the data is more spread out in the first three principal components compared to the first two principal components. This is because the first three principal components capture more variance than the first two principal components.
Explained Variance Ratio
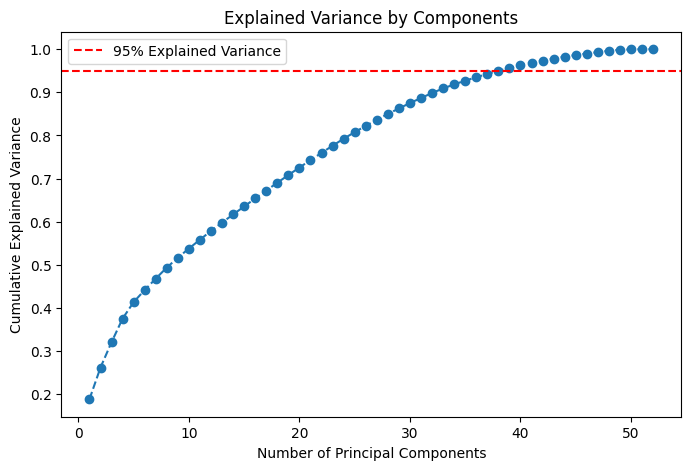
The plot shows the explained variance ratio of each principal component. The first principal component captures the most variance, followed by the second, and so on. The explained variance ratio of each principal component is the proportion of the dataset’s variance that lies along that principal component. From the plot, in order to retain 95% of the variance, we need to consider the first 39 principal components.
By doing this the shape of the data is reduced from (12952, 52) to (12952, 39).
The top 3 eigenvalues are [9.7701, 3.8277 3.0569].
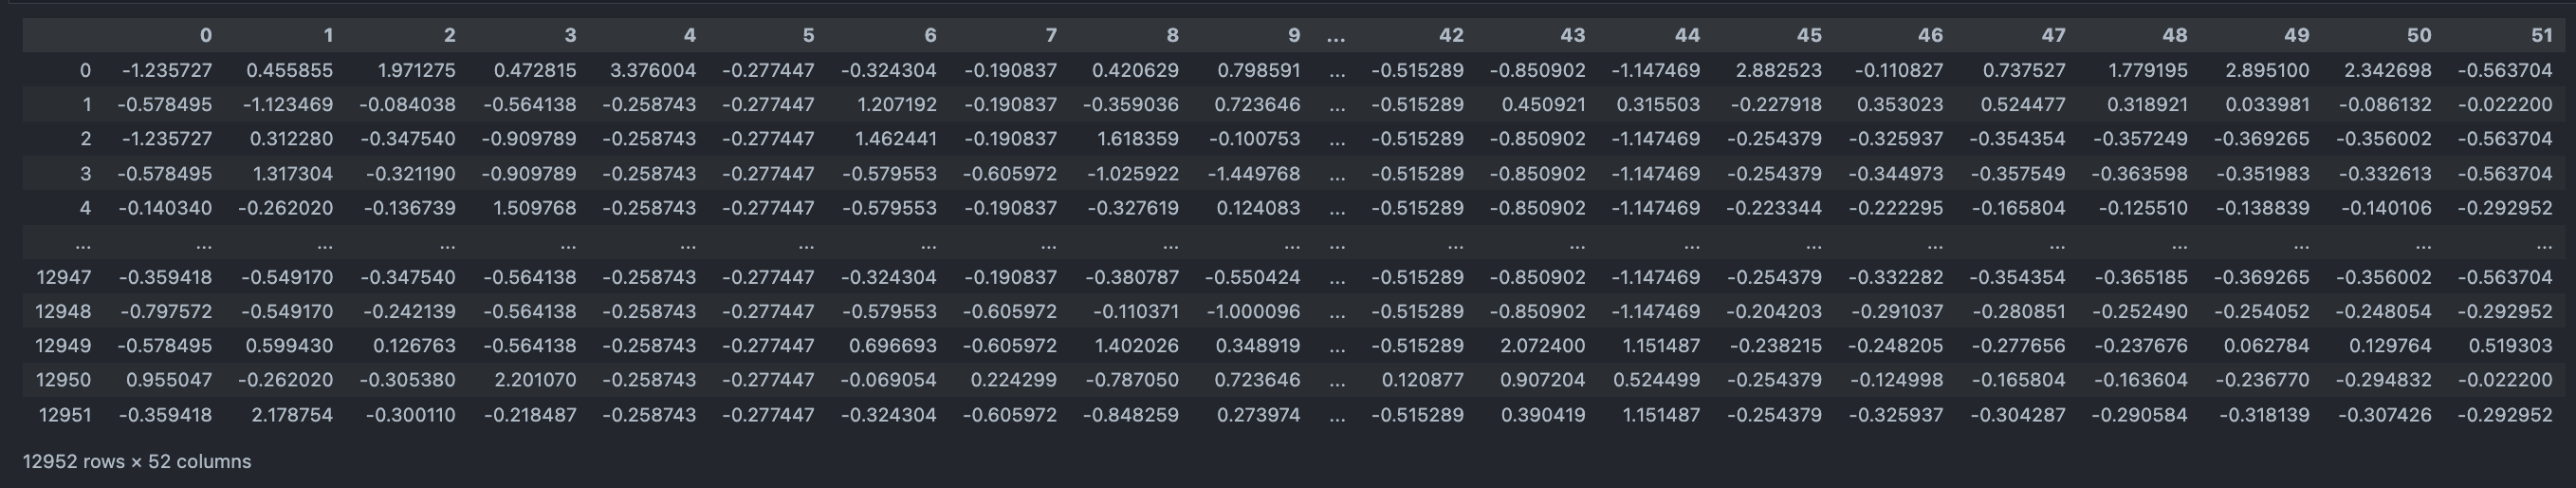
Dataset before PCA (After selecting only numerical columns and standardizing):

Dataset after performing full PCA:
Conclusion
PCA is a powerful technique for dimensionality reduction that can help simplify complex datasets while retaining the most important information. By identifying the directions in which the data varies the most and projecting the data onto a new set of axes aligned with these directions, PCA can help reduce the number of features in a dataset while maintaining the structure and variability of the original data. In this project, we applied PCA to a dataset of football player statistics to reduce the number of features from 52 to 39 while retaining 95% of the variance. This reduced the dimensionality of the dataset and made it easier to visualize and analyze.
The code for implementing PCA can be found here