
Football Analytics - Conclusion
Choosing the best model to predict or understand data can be a bit like choosing the right tool from a toolbox, it really depends on what you’re working with. In our case, we tested a bunch of models on the same task, and the goal was simple: find the one that makes the best predictions. We used different types of models, some that are simple and old-school, others that are more advanced, and looked at how accurate and reliable each one was.
The first big takeaway is that models that combine many simple decisions, like XGBoost, Random Forests, and Gradient Boosting, tend to perform the best. These models don’t try to guess all at once; instead, they take turns, learning from each other’s mistakes. That teamwork pays off. In fact, XGBoost came out on top in every category, it had the best balance between accuracy and consistency. That means it not only got answers right most often, but it did so in a steady and dependable way.
On the flip side, simpler models like the basic versions of Naïve Bayes didn’t do so well. These models work by making strong assumptions about the data, and if those assumptions aren’t true, the results can be pretty weak. This happened here, especially for the Multinomial Naïve Bayes, which struggled to make good predictions. That doesn’t mean it’s useless, it just means it needs the right kind of data to shine.
Another interesting point is that even solid, commonly used models like Logistic Regression and Decision Trees held their own. They were more accurate than many of the simpler models and easier to understand than some of the super complex ones. This makes them great for situations where you want both performance and clarity.
In the end, the main message is clear: there’s no one-size-fits-all model. If you want the best results, especially when you have mixed types of data (like numbers and categories together), models like XGBoost and Random Forests are safe bets. But if you value speed, simplicity, or transparency, simpler models still have a place. The real trick is knowing your data and picking the model that plays to its strengths.
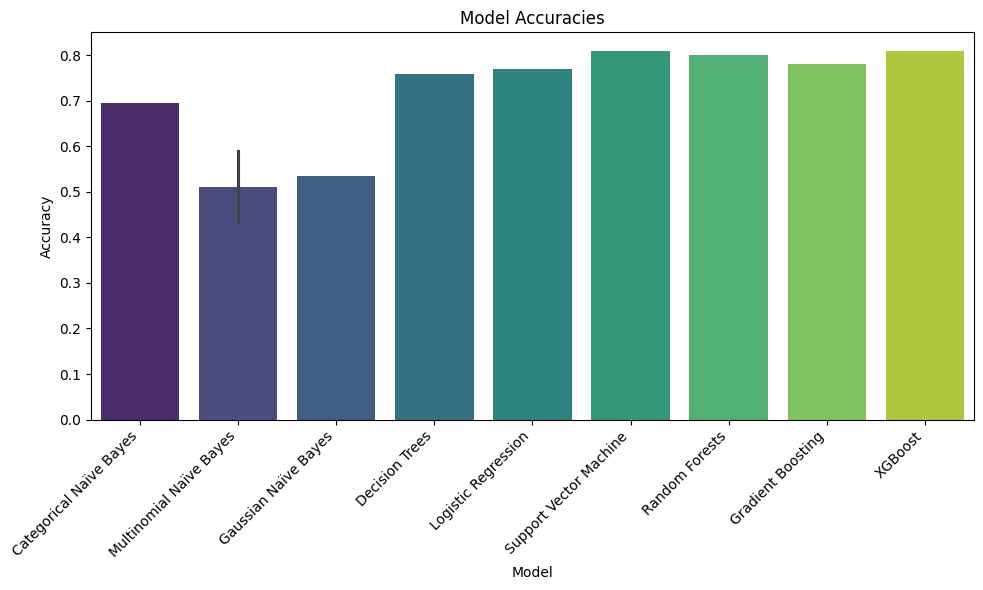
Bar Plot of Model Accuracies
Future Work: Moving Towards Regression
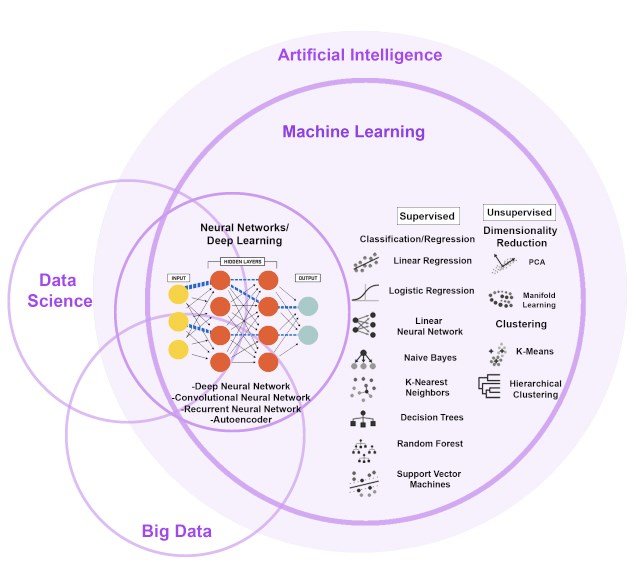
Venn Diagram of ML Models
While classification provides valuable insights into value categories, a natural and potentially more impactful extension is to predict the specific numerical market value of a player using regression techniques. Future studies could explore:
- Regression Model Implementation:
- Tree-Based Ensemble Regressors: Implement regression counterparts of the top-performing classifiers: Random Forest Regressor, Gradient Boosting Regressor, and XGBoost Regressor. These are often effective for tabular regression tasks.
- Linear Models: Use Linear Regression, Ridge, Lasso, or Elastic Net as baselines and potentially effective models if relationships are somewhat linear or if feature selection via regularization is desired.
- Support Vector Regression (SVR): Explore SVR with different kernels to capture non-linear value trends.
- Neural Networks: Design feed-forward neural networks or potentially more complex architectures (if incorporating time-series performance data) to model intricate patterns, though requiring more data and careful tuning.
- Advanced Feature Engineering:
- Develop more sophisticated features, such as player performance indices, age-weighted performance metrics, interaction terms (e.g., goals scored * league strength), or features derived from sequential performance data (e.g., improvement trends over seasons).
- Incorporate external data like team strength, league reputation, detailed injury history, or even sentiment analysis from news/social media regarding a player.
-
Time-Series Considerations: If detailed seasonal data is available, model player value progression over time using techniques sensitive to temporal dependencies (e.g., LSTMs, ARIMA models adapted for panel data).
-
Enhanced Data & Granularity: Utilize larger datasets covering more leagues, player tiers, and historical periods. Incorporate more granular data like detailed positional roles (e.g., deep-lying playmaker vs. box-to-box midfielder) or event data from matches (e.g., xG, xA).
- Model Interpretability for Regression: Employ techniques like SHAP or LIME to understand which features drive the predicted numerical value for individual players, providing actionable insights beyond just accuracy metrics (e.g., Mean Absolute Error, RMSE).
By pursuing these regression-focused avenues, the analysis can move from categorical bucketing to precise market value estimation, offering deeper insights for scouting, player management, and financial planning within football clubs.