
Football Analytics - Introduction
Football is one of the most widely followed and played sports globally, with millions of players, clubs, and fans contributing to its thriving ecosystem. The performance of individual players, along with their market value and contract details, plays a significant role in the success of football clubs and the sport’s financial dynamics. This dataset includes comprehensive information on 12,952 football players, tracking key performance metrics over multiple years, such as goals, assists, minutes played, and disciplinary records. Additionally, it offers insights into player market values, contract expiration dates, and even rankings based on their performance. Such data is invaluable for football analysts, scouts, clubs, and fans who want to evaluate player contributions, trends, and the financial aspects of the sport.
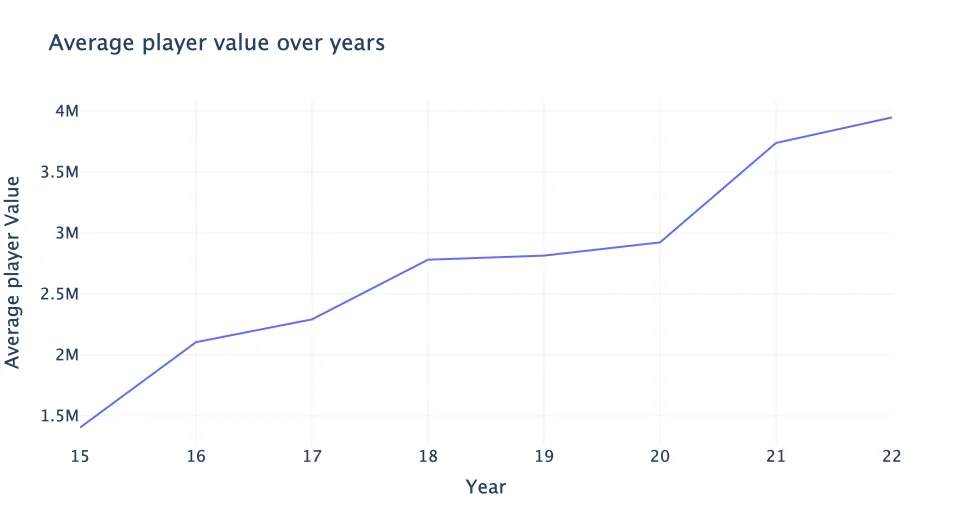
Average player FIFA value across years (15 represents 2015)
Just like the stock market, the transfer market in football is a constantly fluctuating landscape, with players’ values rising and falling based on performance and a wide range of other factors. This is the collective growth of players’ prices over time. One reason for this inflation is the huge increase in clubs’ revenues over the last decade. It’s clearly visible that the average price grew consistently over this period, suggesting inflation in FIFA player value over the last decade. Images by author. As demonstrated above, the entire market is susceptible to macro trends.
The impact of this data extends beyond mere statistics; it provides a foundation for predictive models and machine learning applications. Analyzing the data can help identify patterns in player performance over time and predict future trends, such as potential increases or decreases in market value. Furthermore, such analysis can be applied to real-time applications, including fantasy football, sports betting, and player scouting. The dataset can even serve as a tool to assess the economic effects of player transfers between clubs or the impact of player performance on the success of a team. Given the increasing reliance on data-driven decision-making in sports, this dataset opens the door for numerous applications in the sports industry, providing both valuable insights and actionable strategies.
In this study, we implement a machine learning pipeline to classify the value of football players based on performance metrics, contract details, and demographic attributes. The dataset undergoes preprocessing, including categorical encoding for non-numeric features and standardization of numerical variables to ensure consistency. To address class imbalance, we apply a balanced sampling strategy, ensuring equal representation of both valuable and non-valuable players. Furthermore, we employ statistical techniques to detect and remove outliers, improving the quality and reliability of the dataset before model training.
Following data preparation, we split the dataset into training and test sets and apply machine learning models for classification. Feature scaling is performed using standardization to optimize model performance, while label encoding ensures categorical variables are effectively incorporated into the learning process. Various classification models are evaluated to determine the most effective approach for predicting player value. The pipeline is designed to enhance model robustness and generalizability, ensuring that insights derived from the data are both accurate and applicable in real-world football analytics.
Questions to Explore
- How do player market values correlate with their performance metrics (goals, assists, minutes played)?
- What factors most influence a player’s market value increase or decrease?
- How does the player’s position on the field affect their overall performance and market value trends?
- Are there any significant correlations between player age and their performance over time?
- What patterns can be found in contract expiry dates and subsequent player transfers?
- How do yellow and red cards impact a player’s performance and market value?
- Can we predict the future market value of a player based on their current performance trends?
- How do players’ performance rankings change over the course of their careers?
- What is the impact of playing in a high-profile club on player performance and market value?
- Can the model predict market values of goalkeepers with the current metrics?
Visualizations
- Distribution of Player Ages
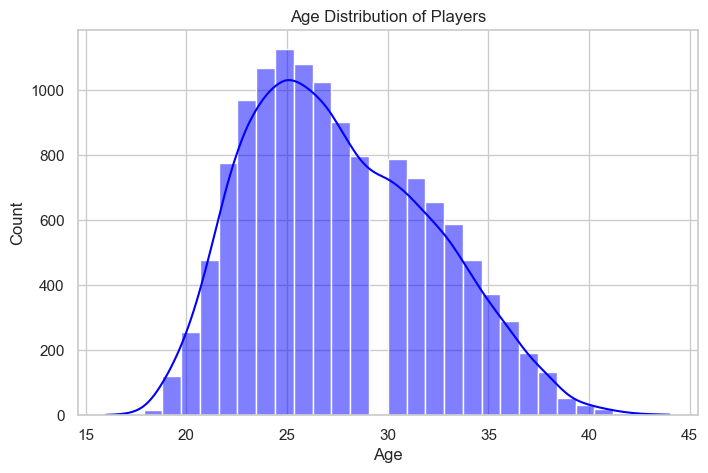
We can observe that most of the players are between 20-30 years old, with a few outliers in the 40-55 and 15-20 age range. It it slightly left skewed.
- Distribution of Market Values
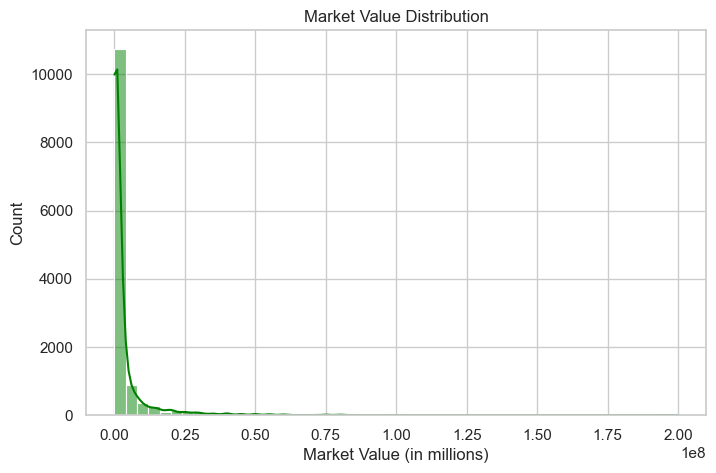
We can see that the distribution of market values is extremely left skewed. Most of the players have a market value of less than 10 million euros, with a few outliers having values greater than 100 million euros.
- Outfitter Distribution
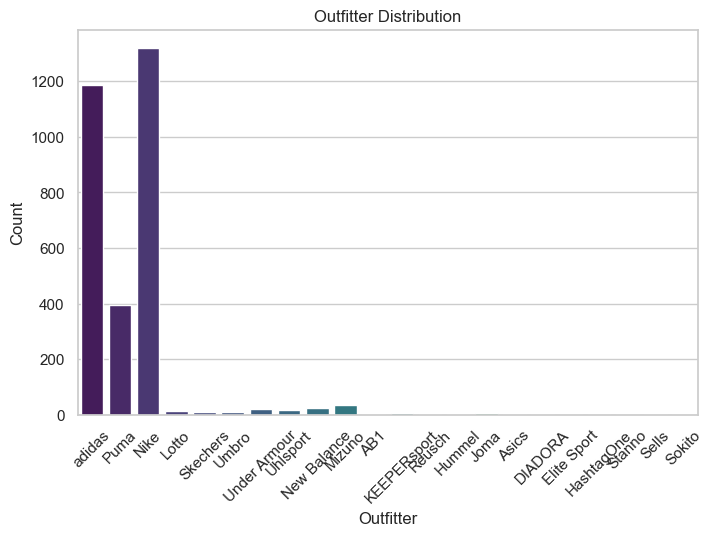
We can see that Nike and Adidas are the most popular outfitters among the players, with a few players having other outfitters like Puma, New Balance, and Under Armour.
- Top 10 Clubs by Player Count
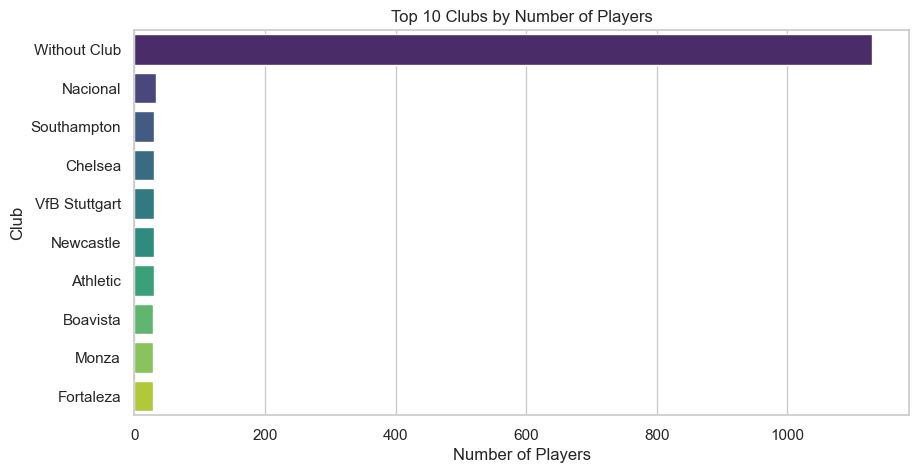
This graph makes sense because most of the players do not have a club, and the players are distributed among the clubs. The top 10 clubs have a player count of around 0-20.
- Preferred Foot Distribution
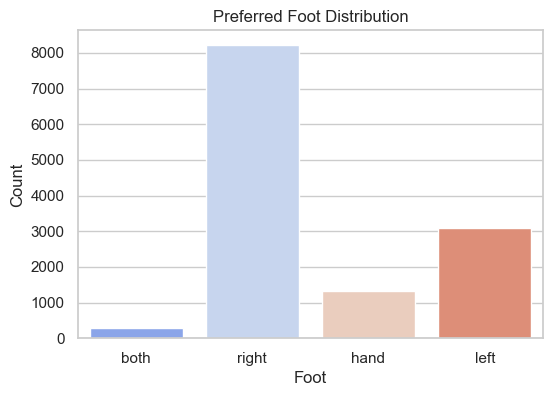
We can see that most of the players are right-footed, with the proportion of players being left-footed being lesser and even fewer being ambidextrous. ‘Hand’ indicates that the player is a goalkeeper.
- Goals vs. Minutes Played (Bubble Plot)
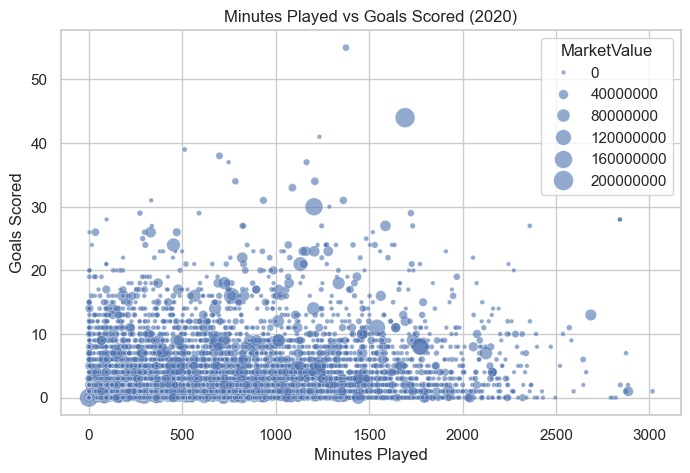
This plot shows the relationship between the number of goals scored by a player and the minutes played. The size of the bubble represents the number of assists by the player. We can see that most of the players have scored 0-20 goals and have played 0-1000 minutes.
- Market Value Over Years
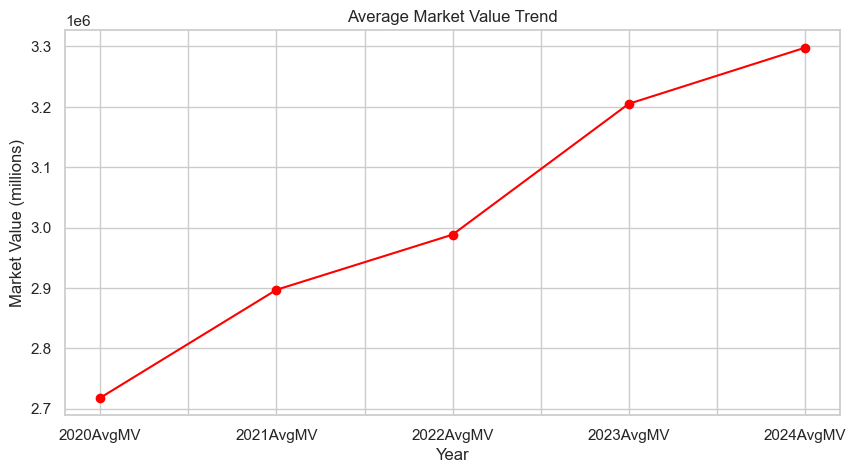
We can see that there is a general increase in the market value of players over the years, with a few fluctuations. The market value of players has increased significantly over the years, with a few players having a market value of more than 100 million euros.
- Height Distribution
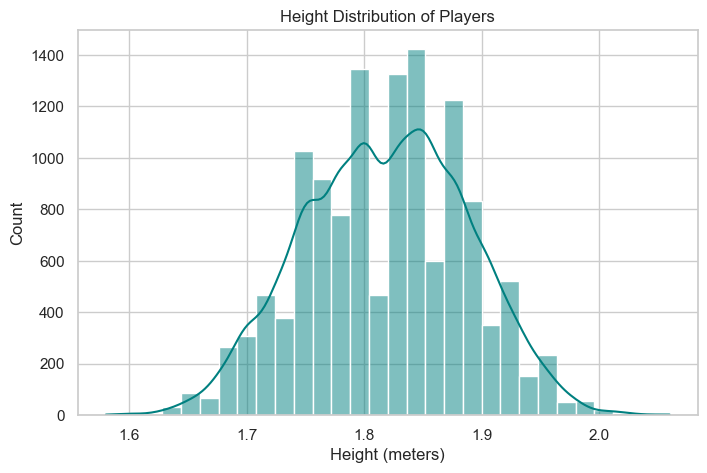
We can see that the height is distributed around 1.9m with a few outliers in the 1.5m and 2.2m range. It is slightly right skewed.
- Ranking vs Total Cups Won
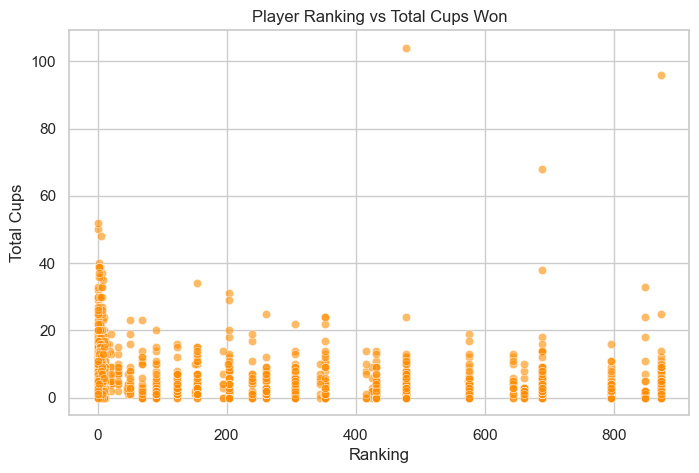
This plot shows the relationship between the player ranking and the total number of cups won by the player. We can see that most of the players have won 0-20 cups.
- Top 10 Players by Total Goals + Assists
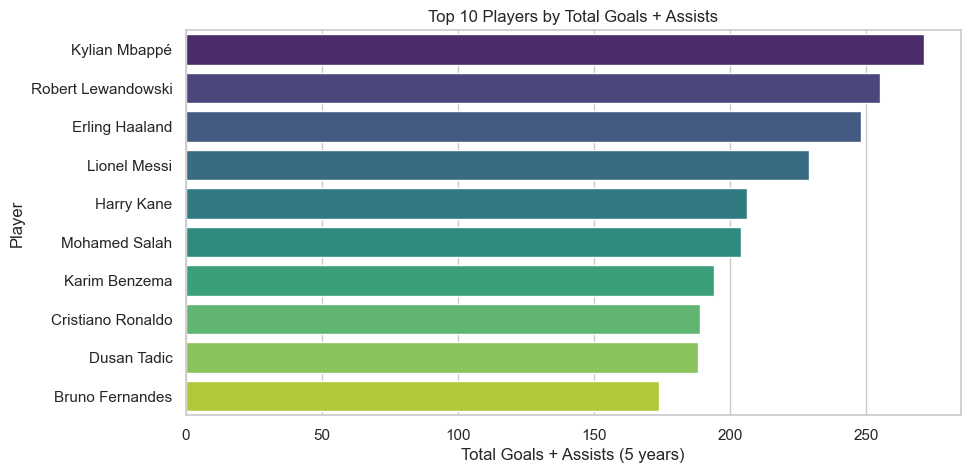
This plot shows the top 10 players by the total number of goals and assists. Kylian Mbappe has the highest number of goals and assists, followed by Robert Lewandowski and Erling Haaland.
- Distribution of Players by National
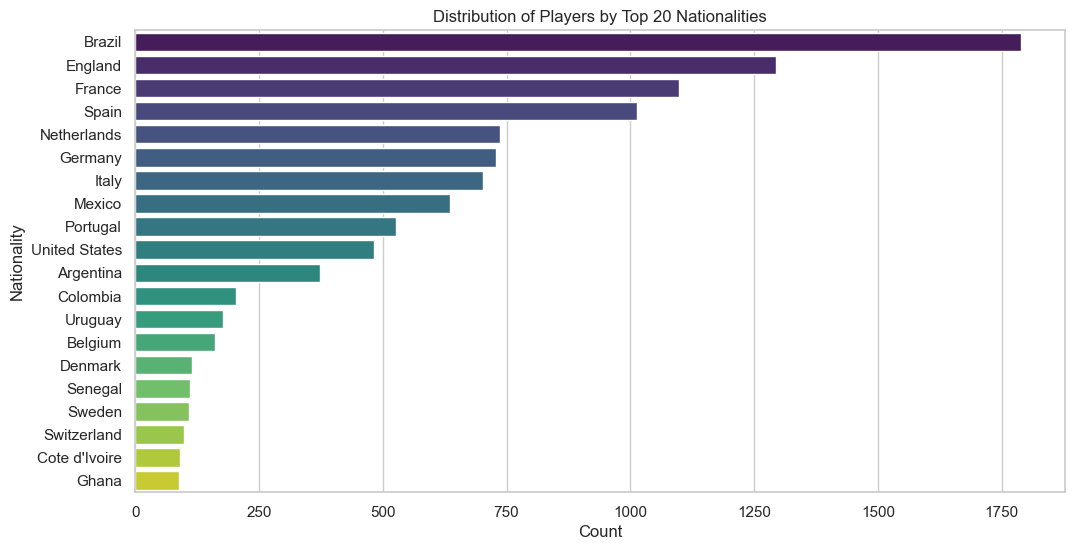
We can see that most of the players are from Brazil, followed by England, France, and Spain. There are players from various countries, with a few players from countries like Ghana, Senegal, and Sweden.
- Top 20 Clubs with Highest Market Value of Players in 2024
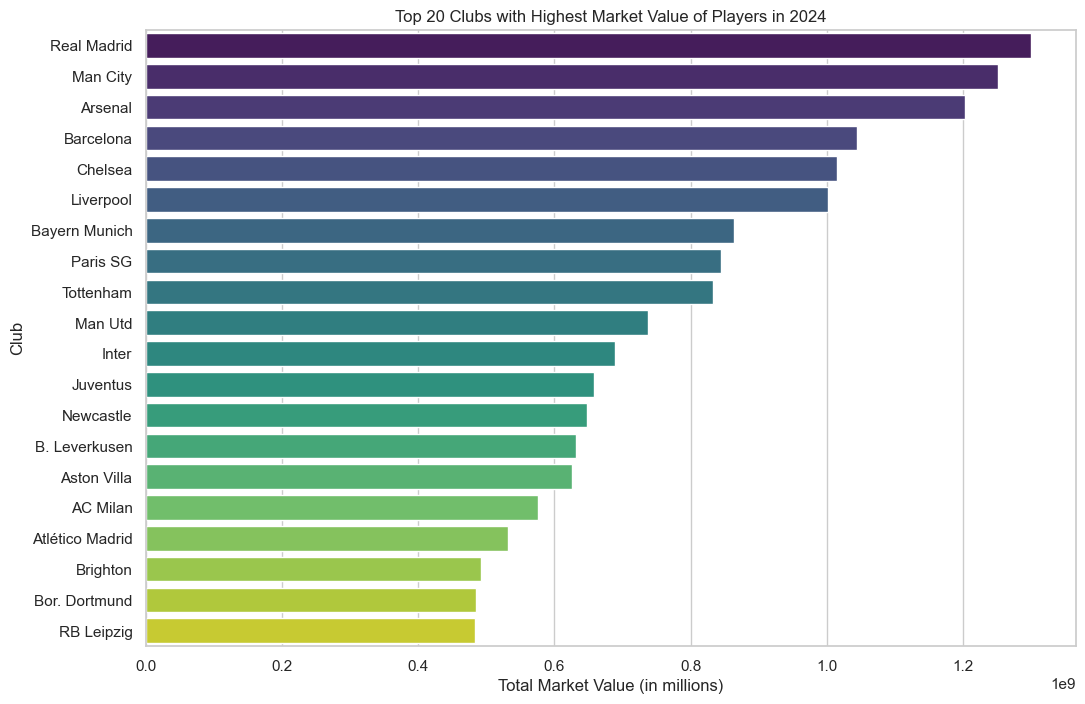
The top 20 clubs with the highest market value of players in 2024 are shown in the plot. Real Madrid has the highest market value of players, followed by Manchester City and Arsenal.
- Top 25 players by Total Goals + Assists in 2025
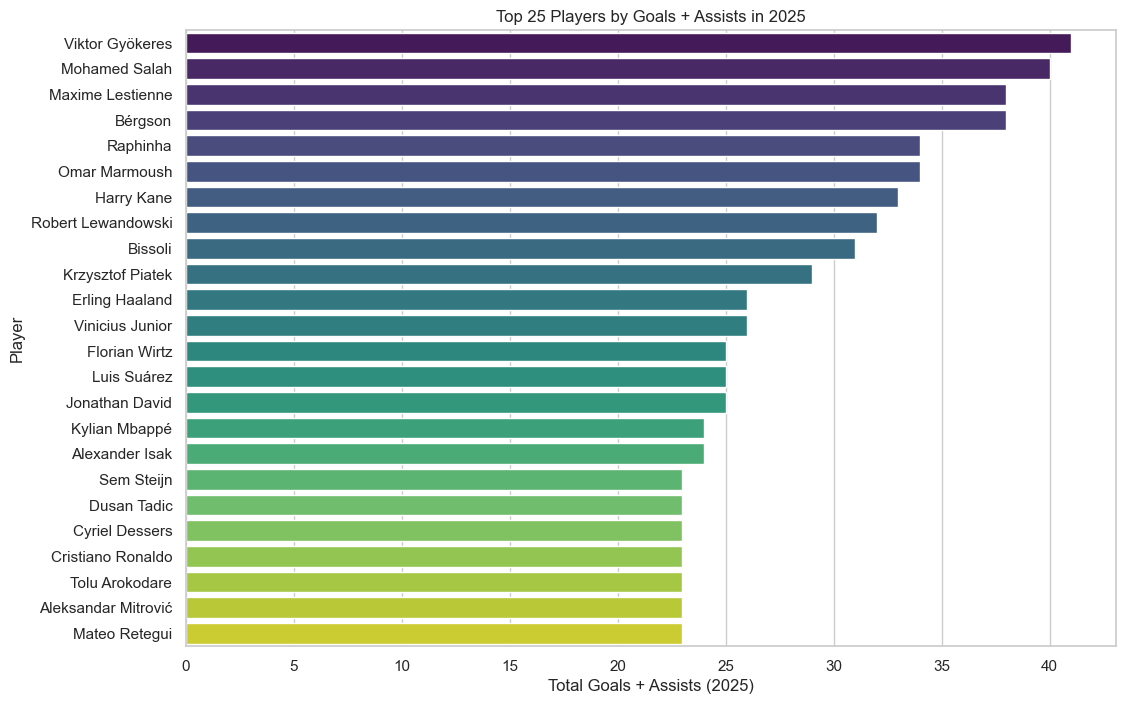
In football goals and assists are the most important metrics to measure a player’s performance. This plot shows the top 25 players by the total number of goals and assists in 2025. Viktor Gyökeres has the highest number of goals and assists, followed by Mohamed Salah and Maxime Lestienne. This is based on the stats when the data was collected (Feb 2025).